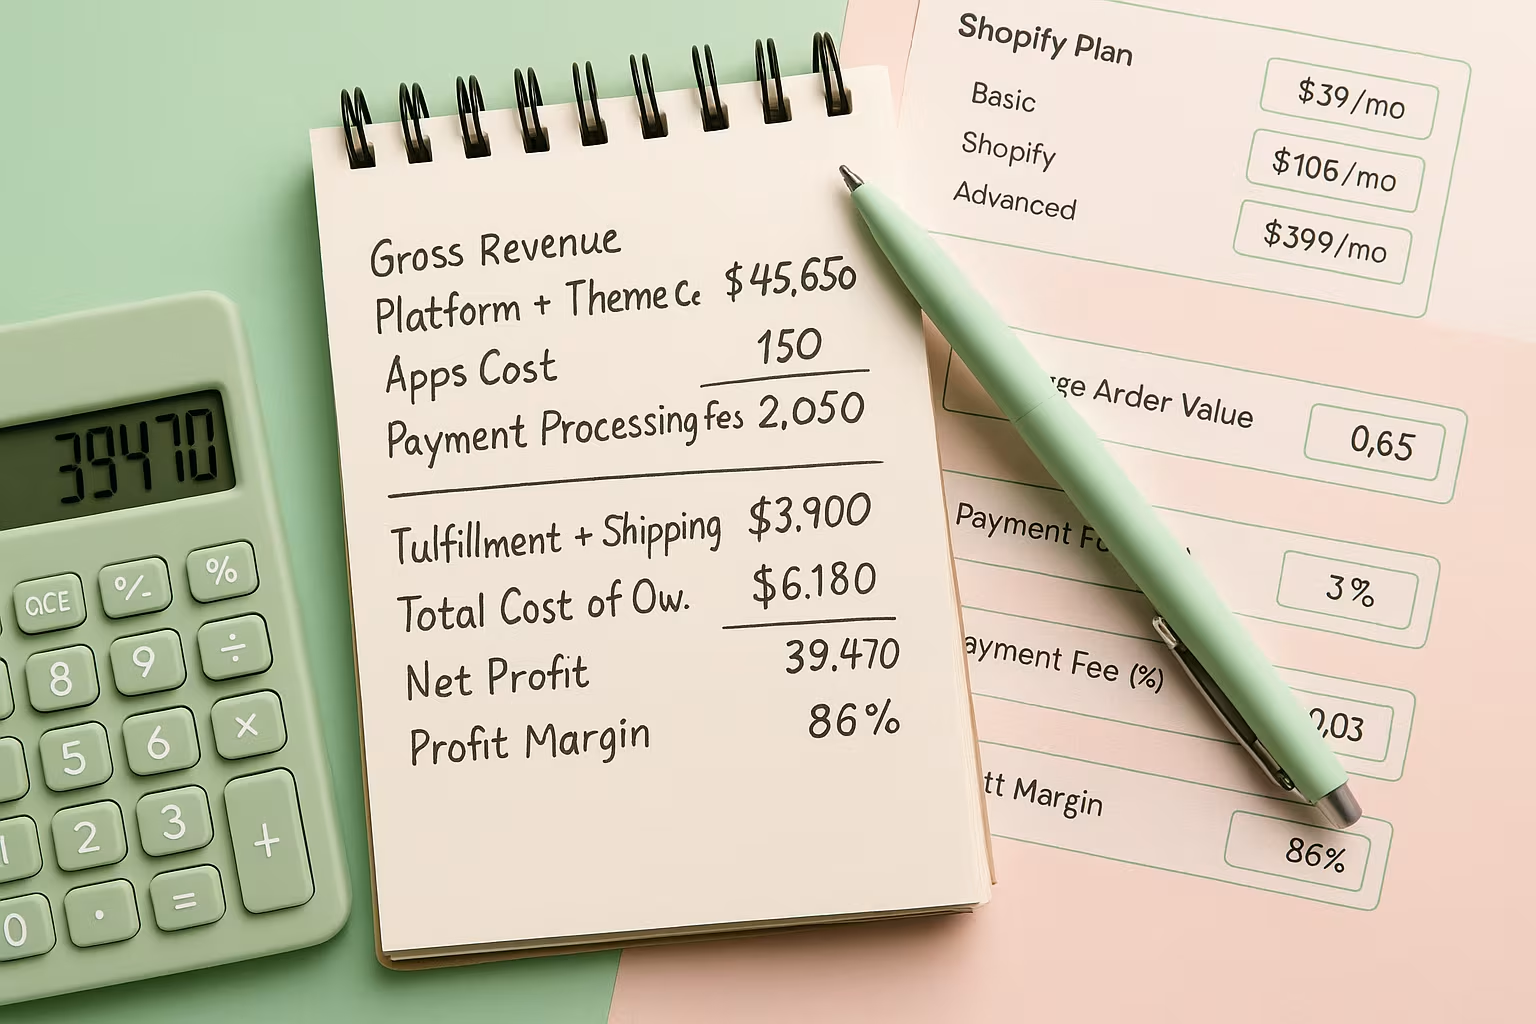
Selling on Shopify comes with more than just platform fees and product costs . When running a brand, especially in the fast-moving worlds of e-commerce and dropshipping, the true cost structure runs deeper.
The Shopify store total cost of ownership calculator is built to give sellers full visibility into every moving part : from fulfillment and apps to processing fees and marketing overhead.
Understanding this isn’t just good housekeeping, it’s what separates scalable brands from hobby stores.
This tool is designed to reflect the real-world complexity of running a Shopify-based private label business . Instead of guessing at net profit, it maps the total financial landscape based on monthly operations.
Shopify plan fees vary, and this calculator accounts for each pricing tier (Basic, Shopify , Advanced) as well as custom plans. It also lets sellers amortize one-time theme purchases over a chosen number of months to reflect how they impact monthly cash flow.
Apps can quietly become a significant operational cost. The calculator includes monthly app fees , helping brands quantify the cumulative effect of tools like Klaviyo, subscription apps, upsell widgets, review platforms, and more.
It’s not just the 2.9% that stings. With flat fees (like $0.30/order) added on, processing costs can erode margins if not actively tracked. This calculator factors in both percentage and flat fees, giving a more accurate view of transaction-level losses.
For sellers who use dropshipping platforms or 3PLs, fulfillment can fluctuate by SKU , weight, or zone. The calculator takes per-order fulfillment and shipping costs and multiplies them by monthly volume, painting a clearer cost-per-order picture.
Two core inputs drive the whole model: Average order value and monthly order volume. Adjusting these helps sellers forecast profits based on real sales metrics or hypothetical growth scenarios.
Even if a brand is organic-first, some level of paid advertising is typically involved . Whether it’s Meta, Google, influencer UGC, or email list growth, monthly ad spend is a key input.
Lastly, the calculator accounts for the "everything else" bucket , VA hours, product photo shoots, legal support, and warehouse software. These often go untracked until profits shrink.
Once all inputs are added, the calculator outputs:
Most beginner ecommerce calculators oversimplify. They might track product cost and selling price , but that’s a surface-level view. Private-label businesses, especially those building long-term assets, carry real infrastructure behind the scenes.
Small recurring expenses are easy to overlook individually, but together, they can erode margin at scale. Tracking each component in isolation leads to a poor pricing strategy and misinformed growth plans. This calculator groups them all in one place, making the full impact visible:
These add up quickly. Without modeling these costs, decisions like discounting, bundling, or offering free shipping become risky.
A store doing 100 orders/month and one doing 1,000 face entirely different TCO realities. As order volume increases , so do fulfillment spending and payment fees. Knowing where margins compress allows sellers to course-correct before they scale unprofitably.
Even seasoned operators fall into traps that erode profits silently. This tool exists to help avoid the most common mistakes:
The revenue feels good. It doesn’t mean much. Profit margin is what matters, and that’s often less than expected once processing , fulfillment , and app fees are factored in.
Theme, branding , and setup costs may be one-time, but they still need to be accounted for monthly . Not doing so means overestimating profit.
Different SKUs, zones, or packaging options can swing fulfillment pricing . Assuming flat costs across the board can lead to skewed analysis.
Ad spending doesn’t just drive traffic; it drives CPA (cost per acquisition). Without proper tracking, aggressive campaigns can cannibalize margins instead of fueling growth.
To see how the Shopify Store Total Cost of Ownership Calculator works in practice, let’s run a realistic scenario with private labeling : a mid-stage private label seller with consistent monthly volume. This example breaks down the full cost structure and reveals what many store owners often miss.
With all costs input, the calculator gives a full breakdown . From $13,750 gross revenue, the tool maps out ~$513 in processing fees, $1,875 in logistics, and a net profit of around $8,500, leaving a healthy ~62% margin. This level of insight helps sellers optimize further or stress test their assumptions.
This clarity helps the seller decide if bundling, price increases, or switching fulfillment partners are worth testing.
Looking at total store profit is a start, but it can hide underperforming products. One SKU might be eating into margins due to higher shipping weight or higher ad costs, even if the overall profit looks strong.
To fix this, sellers should go beyond averages and tag specific costs by SKU. The calculator shows store-wide numbers, but combining it with SKU-level tracking reveals:
This is how experienced operators fine-tune margins and avoid scaling loss-making SKUs.
This isn’t a one-and-done tool. The most effective brands use it proactively:
The Shopify store total cost of ownership calculator gives ecommerce sellers the precision needed to make smarter decisions , not just guesses.
Margins live or die by what gets tracked. With one tool, sellers can see the real math behind each month and build a more resilient, profitable business.
Whether dropshipping, running small-batch custom inventory , or scaling a branded storefront, this tool simplifies what used to take hours in spreadsheets.
Clarity isn’t optional; it’s the lever that unlocks scale.
Find answers to all of your unanswered questions
Explore our Help Center for detailed answers, expert advice, and step-by-step guides.