Reinvestment Fund’s Market Value Analyses (MVAs) are typologies of local real estate markets, designed to help governments and private investors target investment and prioritize action in ways that can leverage investment and revitalize neighborhoods. To develop this analysis, Reinvestment Fund uses a statistical technique known as cluster analysis that helps to uncover patterns in data. Cluster analysis does this by forming groups of areas that are similar along a set of selected values that describe those areas. While the groups are formed to be as uniform as possible within, the groups are also as dissimilar as possible from one another. Using this technique, the MVA is able to reduce vast amounts of data on hundreds of thousands of properties and hundreds of areas down to a manageable, meaningful typology of market types that can inform area-appropriate programs and decisions regarding the allocation of resources. Reinvestment Fund uses many indicators in its analyses including various combinations of the following: average home sale price, percent change in average home sale price over time, percent owner occupancy, percent vacancy, percent vacant lots, percent of rental units that are Section 8, percent commercial, percent of properties with foreclosure, percent prime home purchase loans, number of new construction permits, number of Sheriff sales as a percent of owner occupied units, number of public housing units, percent of properties deemed dangerous, percent of structures demolished, percent of high risk or very high risk credit scores for predatory lending, and percent of housing units built before 1950.
Working with the MVA client, Reinvestment Fund forms geographic study areas for the cluster analysis. Although many of these study areas are displayed using similar color schemes, they can not be compared. Please consult the description relevant to the study area for a full description of each MVA.
Reinvestment Fund’s Market Value Analysis (MVA) describes the characteristics of the block groups within a study area. In 2018, Reinvestment Fund updated the Market Value Analysis in Jacksonville. The MVA indicators in Duval County are noted below and represent the dimensions upon which block groups are analyzed:
Reinvestment Fund’s Market Value Analysis (MVA) describes the characteristics of the block groups within a study area. The MVA indicators in Jacksonville are noted below and represent the dimensions upon which block groups are analyzed:
Reinvestment Fund’s Market Value Analysis (MVA) describes the characteristics of the block groups within a study area. In 2024, Reinvestment Fund updated the Market Value Analysis in Atlanta. The MVA indicators in Atlanta, GA are noted below and represent the dimensions upon which block groups are analyzed:
Reinvestment Fund’s Market Value Analysis (MVA) describes the characteristics of the census tracts within a study area. The MVA indicators in the Atlanta Metro region (Clayton, Cobb, DeKalb, Fulton, and Gwinnett counties) are noted below and represent the dimensions upon which census tracts are analyzed:
Reinvestment Fund’s Market Value Analysis (MVA) describes the characteristics of the block groups within a study area. In 2017, Reinvestment Fund updated the Market Value Analysis in Baltimore. The MVA indicators are noted below and represent the dimensions upon which block groups are analyzed:
Reinvestment Fund’s Market Value Analysis (MVA) describes the characteristics of the block groups within a study area. In 2014, Reinvestment Fund updated the Market Value Analysis in Baltimore. Indicators are noted below and represent the dimensions upon which block groups are analyzed:
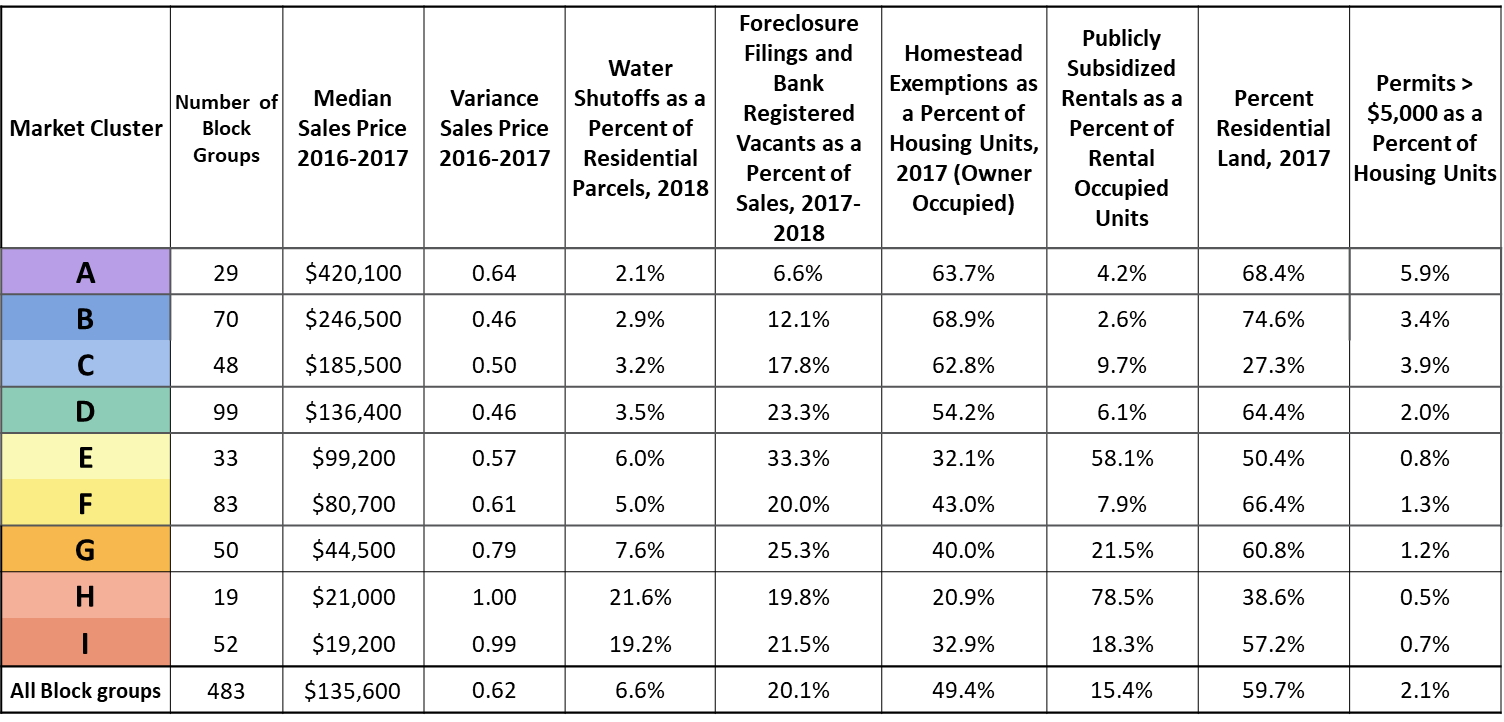
Reinvestment Fund cluster analysis revealed nine market types, characterized as follows:
Reinvestment Fund cluster analysis revealed seven market types, characterized as follows:
Reinvestment Fund’s Market Value Analysis (MVA) describes the characteristics of the block groups within a study area. The MVA indicators in Kansas City are noted below and represent the dimensions upon which block groups are analyzed:
The MVA indicators in Asbury Park are noted below and represent the dimensions upon which block groups are analyzed:
Reinvestment Fund cluster analysis revealed eight market types, characterized as follows:
The MVA indicators in Camden are noted below and represent the dimensions upon which block groups are analyzed:
In 2000 Reinvestment Fund developed a Market Value Analysis of Camden for the New Jersey Department of Community Affairs. Reinvestment Fund cluster analysis revealed six market types, as follows:
Reinvestment Fund cluster analysis revealed five market types, characterized as follows:
The MVA indicators in Newark are noted below and represent the dimensions upon which block groups are analyzed:
The MVA indicators in Paterson and Southern Passaic County are noted below and represent the dimensions upon which block groups are analyzed::
Reinvestment Fund cluster analysis revealed six market types, characterized as follows:
Reinvestment Fund’s Market Value Analysis (MVA) describes the characteristics of the block groups within a study area. The MVA indicators in the 2016 MVA for Allegheny County are noted below and represent the dimensions upon which block groups are analyzed:
The table below shows each component’s average for each MVA category.
Reinvestment Fund’s cluster analysis revealed nine market types, characterized as follows:
Reinvestment Fund’s Market Value Analysis is a unique tool for characterizing markets as it creates an internally referenced index of a municipality’s residential real estate market. In 2017, the first Market Value Analysis was developed for Bethlehem, PA. Below are the indicators used in the 2017 Bethlehem MVA:
Reinvestment Fund’s Market Value Analysis (MVA) describes the characteristics of the block groups within a study area. The MVA indicators in Philadelphia are noted below and represent the dimensions upon which block groups are analyzed:
Reinvestment Fund’s Market Value Analysis (MVA) describes the characteristics of the block groups within a study area. The MVA indicators in the 2015 MVA for Philadelphia are noted below and represent the dimensions upon which block groups are analyzed:
In 2011, Reinvestment Fund developed a Market Value Analysis for the City of Philadelphia.
Reinvestment Fund’s Market Value Analysis (MVA) describes the characteristics of the block groups within a study area. The MVA indicators in Milwaukee are noted below and represent the dimensions upon which block groups are analyzed:
The tables below show each component’s average for each MVA category.
Also, it is worth noting that the Milwaukee MVA widget also includes additional data layers that are not on the PolicyMap maps page and were not included in the MVA analysis, and thus are not listed above. These include the Total Number of Establishments, Total Number of Employees, and Total Number of Sales, which are all from the National Establishment Time-Series (NETS). PolicyMap received these layers, as well as residential sales indicators, from Reinvestment Fund’s Policy Solutions department.