Machine Learning December 4, 2021 Clustering , Machine Learning , Unsupervised Machine Learning Comments Off on K-Means Clustering 11,575 Views
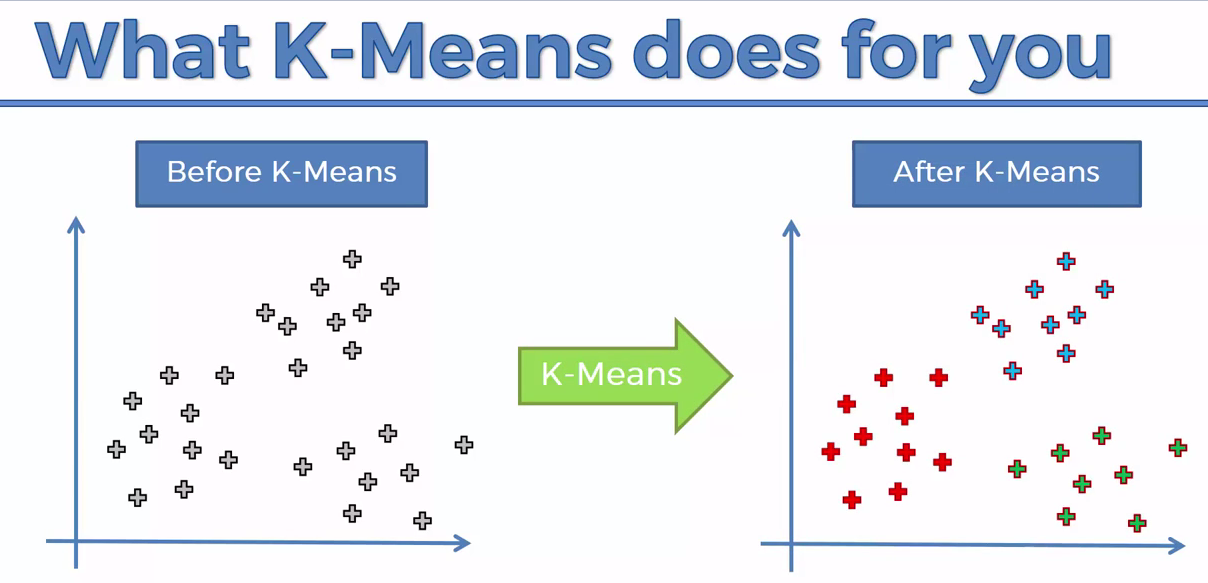
K-means clustering is a type of unsupervised learning, which is used when you have unlabeled data (i.e., data without defined categories or groups). The goal of this algorithm is to find groups in the data, with the number of groups represented by the variable K. The algorithm works iteratively to assign each data point to one of K groups based on the features that are provided. Data points are clustered based on feature similarity.
In Simple, It follows a simple procedure of classifying a given data set into a number of clusters, defined by the letter “k,” which is fixed beforehand. The clusters are then positioned as points and all observations or data points are associated with the nearest cluster, computed, adjusted and then the process starts over using the new adjustments until a desired result is reached.
To process the learning data, the K-means algorithm in starts with a first group of randomly selected centroids, which are used as the beginning points for every cluster, and then performs iterative (repetitive) calculations to optimize the positions of the centroids
K={2,3,4,10,11,12,20,25,30}
Let say, we want to create two clusters, Take K=2
As we are randomly select the two mean values: Lets cal for Cluster
As we got the same mean, so we have to stop so our new cluster is :
To find the number of clusters in the data, the user needs to run the K-means clustering algorithm for a range of K values and compare the results. In general, Earlier there is no method for determining exact value of K, but an accurate estimate can be obtained using the following techniques.
One of the metrics that is commonly used to compare results across different values of K is the mean distance between data points and their cluster centroid. Since increasing the number of clusters will always reduce the distance to data points, increasing K will always decrease this metric, to the extreme of reaching zero when K is the same as the number of data points. Thus, this metric cannot be used as the sole target. Instead, mean distance to the centroid as a function of K is plotted and the “elbow point,” where the rate of decrease sharply shifts, can be used to roughly determine K.
200 rows × 5 columns