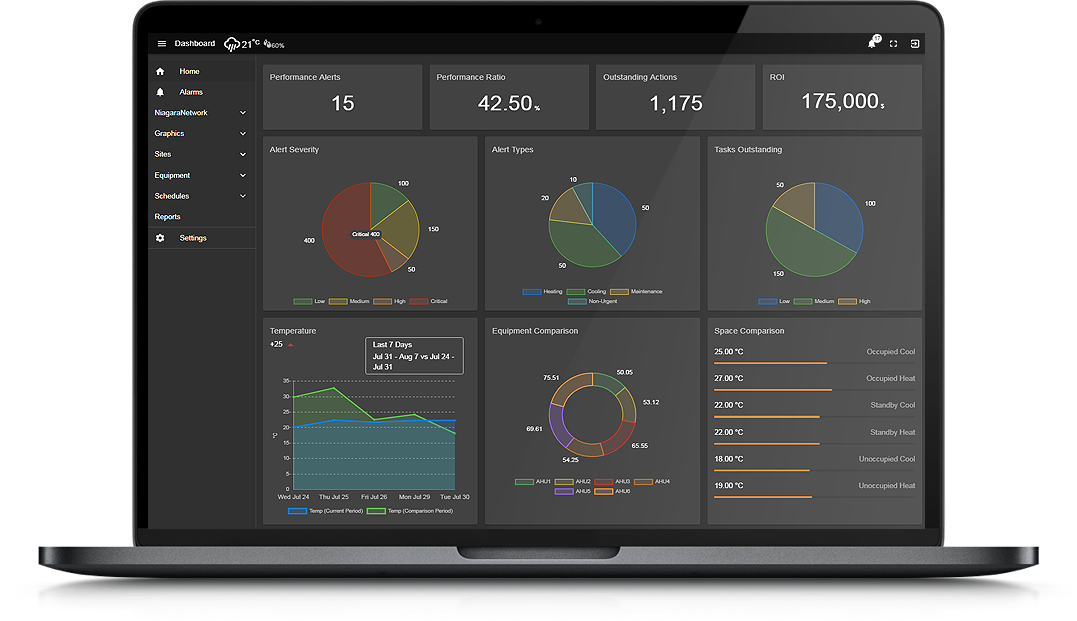
N4 Insights 365 as standard already includes reporting features, scheduled reports of trends, points, and alarms (examples...) , tenant billing with invoicing, but what is upcoming is the actionable recommendations, exploring historical performance with a unique time-lapse feature, and empower your engineers to refine and master your building's energy efficiency, detect anomalies, create what-if scenarios, forward models, predictive maintenance, a master optimization table, without any AI intervention.
N4 Insights doesn't require any complex tagging or have any license limits. It uses implied tags and BQL to retrieve the data required for analysis. Usually historical data to build a model. N4 Insights has a web API so 3rd party integrators can retrieve data without any limitations. A combination of polling and caching is used to limit the usage of station resources.
N4 Insights has a web API so 3rd party integrators can retrieve data without any limitations. A combination of polling and caching is used to limit the usage of station resources.
Algorithms include AVG, MIN, MAX, SUM, etc. The interval period is automatically calculated to show the correct volume of data. The data retrieved can be used with N4 View Builder ™© . Data is plotted on a Line Chart and can be compared with previous date ranges. + or - arrows indicate whether data has increased or decreased over the periods selected.
N4 Analytics - if you have created station analytics using algorithms and tagging, data can be plotted onto charts for analysis. Export data in CSV format to further analyze data.
N4 Automated Reports - create daily, weekly, monthly automated reports. Drag n' drop histories, points, alarm tables, and other niagara objects onto email templates. Or use it for tenant billing purposes.
The IDP service is used by our mobile and IOT applications to create a secure connection between station and our servers.
Are you looking for a cost effective way to manage and visualize data for all your customers? Why not have a look at View Builder ?
Algorithms include AVG, MIN, MAX, SUM, and COUNT. Large recordsets are quickly processed in the most efficient way, server-side.
The interval period is automatically calculated to show the correct volume of data. Standard times ranges are included: today, yesterday, thisWeek, lastWeek, thisMonth, lastMonth, thisYear, lastYear, weekToDate, monthToDate, yearToDate, or custom.
N4 Insights has its own Web Api and can be used on any station to retrieve data quickly using an advanced caching mechanism.
back to more dashboards...
Build Your Own dashboards and win Projects by showing data that increase value and reduces expenditure.
Home About Us Current Projects Affiliations Privacy Policy ECommerce Policy
View Builder IOT ™© Mobile Solutions N4 View Builder ™© Niagara PX Graphics
Software Development Consultancy Project Management Graphic Design Knowledge
T: +44 (0)800 511 8446 (UK) +1 888 207 4061 (US)
Copyright © 2025 Works Software & Engineering Ltd. All rights reserved.