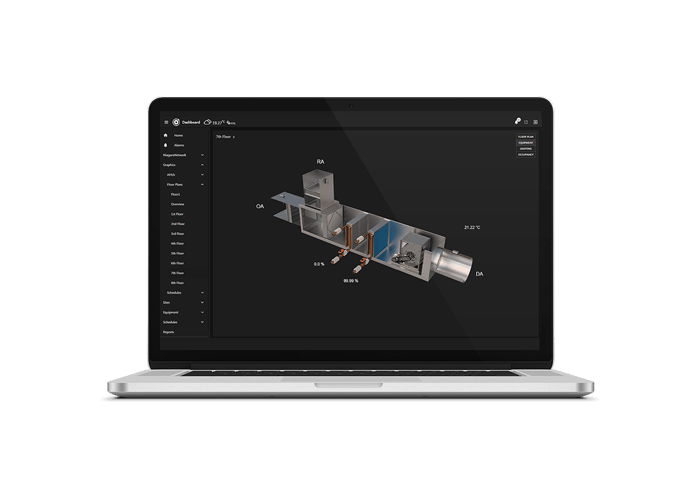
The Floor Plan/Occupancy/ CCTV Zone View & Equipment Builder allows you to add polygon, rectangles, and lines over your existing images to display point values. You can also build animated graphics e.g. Equipment graphics. Add images and bind them to point values. Images and values update in real-time. Setup is done via your browser so you don't need to install any extra components. As an admin or super-user create polygons and rectangles with ord references or link to other plans. When you log on as a non-admin user the image is displayed with clickable polygon areas. Graphics are given control such as overriding set points. Add labels and change font and colours. Shapes can be set up to 3 different colors with values for min, optimal, and max. Shapes change colour in real-time. Add the occupancy icon which binds to a station boolean point to show if the area is occupied. If you have camera feeds that have an rtsp, mjpeg, or similar URL, you can add camera icons and show the feeds in real-time. Make sure the camera has anonymous login and is inside the network. Add up to 5 layers for showing different types of data e.g. occupancy, lighting, HVAC, etc. You can also add static images from your stations shared drive. This template also includes Scheduling View , Energy View , PX View , Alarm View , N4 Alarms To Line Messenger , N4 Alarms To Slack and a Free Weather Service which can be used on any project. Also check out our widgets .
NOTE: we offer a 2d to 3d image conversion service at a very small cost. Please Contact Us us for a quote.
Are you looking for a cost effective way to show equipment graphics to multiple stakeholders? Why not have a look at View Builder .
Create animated equipment graphics. Bind absolute/relative points and ords to change images in real-time.
Save graphics as templates so they can be resused without creating everything again. Relativize points for convenient loading.
Use the preset key commands such as CTRL + D (duplicate) to build graphics quickly.
Display numeric, boolean, string, or enum values anywhere on screen. Values update in real-time.
Navigate to other floor plans with the click of a button. 3d images and values load when navigating to other areas.
Show occupancy icon using any SVG in different areas by binding it to a boolean ord. Toggle between layers for ease-of-use
If you're cameras have an rtsp, mjpeg, or similar URL feed (with anonymous login), add icons on the cavas and show the feeds in real-time.
Add custom SVG icons to the canvas, set its colour, or bind to ord if required.
Click on the point to set, override, or show a history.
Quickly view historical data of points displayed on the graphic.
Replay historical values on screen using the slider to navigate back and forth. You can slide over multiple periods (day, month, year etc). Click above for a demo. Note: this feature is only available in N4 View Builder
back to more dashboards...
Build Your Own dashboards and win Projects by showing data that increase value and reduces expenditure.
Home About Us Current Projects Affiliations Privacy Policy ECommerce Policy
View Builder IOT ™© Mobile Solutions N4 View Builder ™© Niagara PX Graphics
Software Development Consultancy Project Management Graphic Design Knowledge
T: +44 (0)800 511 8446 (UK) +1 888 207 4061 (US)
Copyright © 2025 Works Software & Engineering Ltd. All rights reserved.