This Jupyter notebook plots and compares a field from multiple ice sheet models directly in the notebook.
NOTE: This tool will be updated with a link to the hosted tool and/or source code as soon as it is available. Thank you for your patience during our transition.
Input files must be ISMIP6-formatted ice sheet models with a common experiment and variable name. Inputs may be either Greenland (GIS) or Antarctic (AIS) ice sheet models.
Input data are plotted alongside a reference dataset (the IMAUICE1 ice sheet model) for comparison.
Reference datasets are selected automatically when the tool runs. They are available for the IMAUICE ice sheet model for these ice sheets and experiments:
Models that do not correspond to one of these reference datasets will not be plotted.
The user can specify the projection used: either the model projection information from the netCDF file, or using the standard definition:
The ISMIP6 filename provides information about its contents.
For the example file name: acabf_GIS_IMAU_IMAUICE1_init.nc
The ice sheet model variables are plotted alongside the reference. This output plot is shown directly in the notebook, and stored in png format in the /data/groups/ghub/tools/gisplot2 directory on GHub. The Download Plot button can be used to download the output plot to your local machine. For a successful download, please enable popups in your browser window.
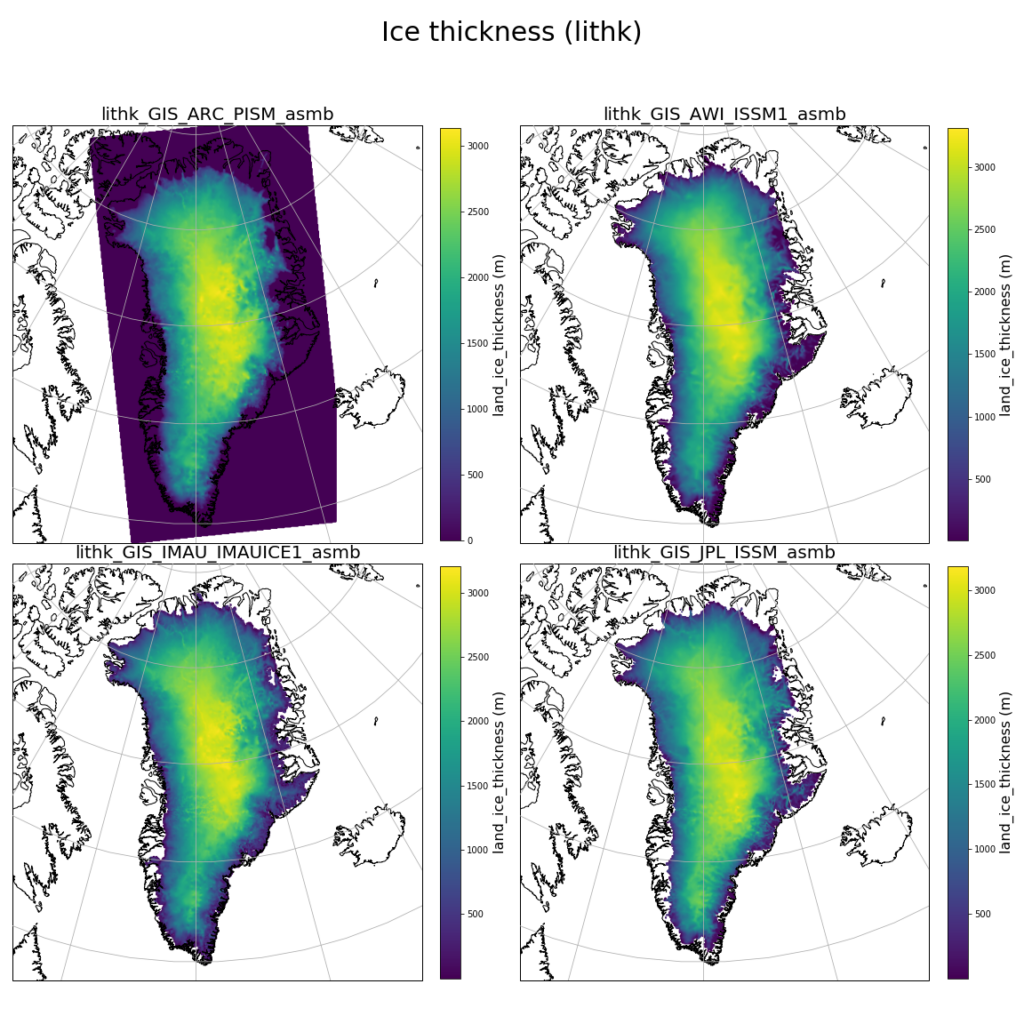
A sample set of output plots are shown. Here, the ice thickness variable is plotted for three user-supplied models of the Greenland ice sheet, and a reference dataset.
This tool plots a single variable from one or several ISMIP6-formatted netCDF ice sheet models for visual inspection, comparison, and download. The output shows plots of the user-selected variable from each model and from a reference dataset (the IMAUICE1 ice sheet model).
Researchers should cite this resource as follows:
Simon, E., Nowicki, S., Snitzer, E., & Sperhac, J. (2021). ISMIP6 Ice Sheet Model Comparison Tool (1.6). The Ghub. https://doi.org/10.5281/zenodo.11086156